Exploring classification accuracy of convolutional neural network architectures with random weights ←
The most prominent settings in a convolutional layer are kernel size, stride and dilation. I've tested all (sensible) permutations of those settings for a 3-layer network and measured image classification accuracy with a linear classifier on top. There are a few architectures that stand out considerably!
The little convolutional networks all look like this:
nn.Sequential(
    nn.Conv2d(in_channels=3, out_channels=32, kernel_size=3|5|7|9, stride=1|2|3, dilation=1|2|3),
    nn.ReLU(),
    nn.Conv2d(in_channels=32, out_channels=32, kernel_size=3|5|7|9, stride=1|2|3, dilation=1|2|3),
    nn.ReLU(),
    nn.Conv2d(in_channels=32, out_channels=32, kernel_size=3|5|7|9, stride=1|2|3, dilation=1|2|3),
    nn.ReLU(),
)
The | symbol means that one of the separated numbers is used for each parameter. So each layer
has 4 * 3 * 3 = 36 possible permutations which leads to 36 ^ 3 = 46,656 possible 3-layer networks
to test.
Testing procedure is as follows and the code is available here:
- create a network with random weights and pass a 3x96x96 image through. If that fails, e.g., because the kernel size of the last layer is larger than it's input, or because the output of the network is larger than the input, the architecture is ignored.
32,629networks pass this test.- Pass the first 500 images of the STL10 training dataset through the network and fit a scikit-learn LinearRidge classifier.
- Pass the first 500 validation images from the dataset through the network and the fitted classifier and calculate the accuracy (the percentage of correctly labeled images).
- If the accuracy is below 25% or the throughput (the number of 3x96x96 images the model can process per second) is below 200, ignore the model.
- Otherwise, repeat this test 5 times, each with new random weights.
1,760networks pass the test and are evaluated 5 times and the average of accuracy and throughput is reported.
The reason for only using 32 channels and only 500 images, obviously, is to make things fast. One test pass takes only about a second.
Here is a plot of all the 5-trial networks. X-axis is throughput, y-axis is accuracy and the color is related to the ratio, the factor by which the input size is reduced by the network.

The accuracy is not very high but that is to be expected when only training on 500 images. I believe that it's still a meaningful measurement for comparing the different architectures. Remember that we only fitted a linear classifier and the CNN weights are completely random.
The top-right architectures in above plot are the interesting ones. They have high accuracy (in comparison) and run fast on my GPU. Here is a hand-picked list:
| kernel size | stride | dilation | throughput | accuracy | ratio |
|---|---|---|---|---|---|
| 7, 3, 5 | 2, 1, 2 | 1, 3, 1 | 1850 | 31.24% | 0.3750000 |
| 7, 3, 9 | 2, 1, 2 | 3, 1, 1 | 2300 | 31.28% | 0.2604166 |
| 9, 3, 7 | 3, 1, 1 | 1, 1, 1 | 2900 | 31.20% | 0.5601852 |
| 9, 3, 7 | 3, 1, 1 | 2, 1, 1 | 3500 | 30.92% | 0.4178241 |
| 9, 3, 5 | 3, 1, 1 | 1, 1, 1 | 2850 | 30.84% | 0.6666666 |
| 5, 5, 3 | 3, 1, 1 | 3, 1, 3 | 3000 | 31.04% | 0.3750000 |
| 7, 3, 3 | 3, 1, 1 | 3, 3, 1 | 5150 | 29.96% | 0.3750000 |
| 7, 3, 3 | 3, 1, 2 | 3, 1, 1 | 6350 | 30.16% | 0.1400463 |
| 5, 3, 5 | 3, 2, 1 | 2, 1, 1 | 6450 | 30.00% | 0.1157407 |
Training these architectures with actual gradient descent, after adding a fully-connected linear layer, on the whole STL10 training set for a hundred epochs, with TrivialAugmentWide augmentation and cross-entropy loss, yields:
| kernel size | stride | dilation | validation loss | val. accuracy | model params | train time (minutes) | throughput* |
|---|---|---|---|---|---|---|---|
| 7, 3, 5 | 2, 1, 2 | 1, 3, 1 | 1.20086 | 57.57% | 143,306 | 6.90 | 1,207/s |
| 7, 3, 9 | 2, 1, 2 | 3, 1, 1 | 1.27710 | 54.09% | 168,970 | 6.72 | 1,239/s |
| 9, 3, 7 | 3, 1, 1 | 1, 1, 1 | 1.21700 | 58.59% | 222,154 | 6.02 | 1,383/s |
| 9, 3, 7 | 3, 1, 1 | 2, 1, 1 | 1.26847 | 54.88% | 182,794 | 5.08 | 1,639/s |
| 9, 3, 5 | 3, 1, 1 | 1, 1, 1 | 1.26713 | 56.65% | 227,018 | 5.15 | 1,617/s |
| 5, 5, 3 | 3, 1, 1 | 3, 1, 3 | 1.24014 | 55.70% | 141,002 | 6.24 | 1,334/s |
| 7, 3, 3 | 3, 1, 1 | 3, 3, 1 | 1.30604 | 52.73% | 126,922 | 6.04 | 1,378/s |
| 7, 3, 3 | 3, 1, 2 | 3, 1, 1 | 1.30700 | 52.63% | 61,962 | 5.93 | 1,406/s |
| 5, 3, 5 | 3, 2, 1 | 2, 1, 1 | 1.20183 | 56.75% | 69,322 | 5.59 | 1,492/s |
| 9, 9, 7 | 2, 2, 1 | 2, 1, 1 | 1.26590 | 54.44% | 173,002 | 5.48 | 1,520/s |
And with 128 instead of 32 convolutional channels:
| kernel size | stride | dilation | validation loss | val. accuracy | model params | train time (minutes) | throughput |
|---|---|---|---|---|---|---|---|
| 7, 3, 5 | 2, 1, 2 | 1, 3, 1 | 1.08960 | 63.91% | 990,986 | 11.91 | 699/s |
| 7, 3, 9 | 2, 1, 2 | 3, 1, 1 | 1.20499 | 59.97% | 1,781,770 | 14.67 | 568/s |
| 9, 3, 7 | 3, 1, 1 | 1, 1, 1 | 1.12620 | 62.67% | 1,601,290 | 6.85 | 1,217/s |
| 9, 3, 7 | 3, 1, 1 | 2, 1, 1 | 1.23929 | 59.92% | 1,443,850 | 7.55 | 1,103/s |
| 9, 3, 5 | 3, 1, 1 | 1, 1, 1 | 1.13976 | 62.14% | 1,325,834 | 7.11 | 1,172/s |
| 5, 5, 3 | 3, 1, 1 | 3, 1, 3 | 1.22916 | 59.92% | 981,770 | 7.11 | 1,172/s |
| 7, 3, 3 | 3, 1, 1 | 3, 3, 1 | 1.24541 | 58.24% | 728,842 | 6.85 | 1,216/s |
| 7, 3, 3 | 3, 1, 2 | 3, 1, 1 | 1.27375 | 56.62% | 469,002 | 6.71 | 1,242/s |
| 5, 3, 5 | 3, 2, 1 | 2, 1, 1 | 1.10181 | 63.36% | 695,050 | 6.14 | 1,356/s |
| 9, 9, 7 | 2, 2, 1 | 2, 1, 1 | 1.33770 | 57.35% | 2,289,418 | 10.91 | 763/s |
*: The throughput is severely limited by the image augmentation stage!
The state-of-the-art accuracy for the STL10 validation set when only training on the STL10 data is 87.3% (arxiv:1708.04552). My little networks are far from this result but they are also pretty small. The original STL10 paper archived 51.5% accuracy with a single layer network (section 4.6).
The 9,3,5 - 3,1,1 - 1,1,1 architecture archived the best convergence speed during training. The loss was
immediately and unusually shooting downwards.
Without the augmentation, all models were overfitting pretty fast and the validation accuracy decreased a lot.
The 9,9,7 - 2,2,1 - 2,1,1 architecture was added for comparison because it had the worst accuracy in the selection experiment before (25.72%).
However, when trained with gradient descent, the 32-channel version gets into the same performance range as the other ones.
That is not true for the 128-channel version. Although it is the largest network, it has the 2nd-worst performance.
Conclusion ←
I don't know, really. The test is just for classification and results might be quite different for other problems. However, the good architectures above do probably behave well in many setups and i will try them whenever i need a little CNN block. Identifying the best performing architectures (using only random weights and fast linear probes) while considering the throughput (which is one of the most important properties for impatient people like me) seems worth the trouble of running this exhaustive experiment.
Is there some rule-of-thumb for setting up the CNN parameters?
Not really, it seems. Larger kernel-size, stride and dilation values should be in the first layers rather than the last ones, but there are exceptions.
Looking at the correlation-plot of parameters and test result values among those 1,760 networks, one can
see a few significant correlations. In below plot, kernel_size-0 means, kernel size of first layer, aso.
train_time is the time it took to fit the linear regression, min_val_acc and max_val_acc are the minimum
and maximum archived validation accuracies among the 5 trials and fitness is some subjective measure
calculated by normalized(accuracy) + 0.3 * normalized(throughput).
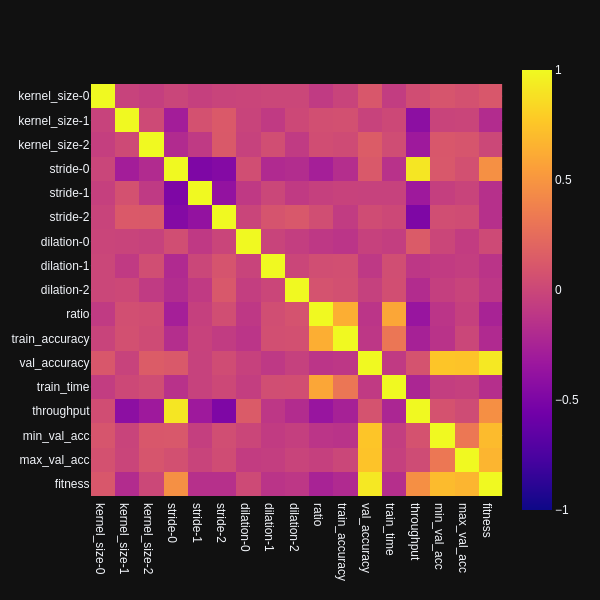
- validation accuracy does not seem to correlate to specific parameters. The largest correlation value is 0.15 with the kernel size of the last layer, followed by 0.12 for the stride of the first layer. Both numbers are well below statistical significance.
- throughput is largely influenced by the size of the stride in the first layer (correlation: 0.9)
- Surprisingly, throughput is negatively influenced by larger stride values in the second and third layer (-0.32, -0.5)
- Not so surprising, throughput is also negatively influenced by larger kernel sizes in second and third layer (-0.42, -0.32)